
The evidence behind better decisions.
Original African consumer data. Historical perspective. Intelligence built for action.
Kasi continuously develops proprietary African consumer intelligence, connecting original observations across markets, time and consumer groups.
Who generates the evidence?
Artificial intelligence has transformed how organisations find, process and communicate information.
But faster analysis does not automatically mean better evidence.
When the underlying information is incomplete, outdated or unavailable, AI cannot reliably fill the gap simply by generating a more convincing answer.
Kasi starts with original evidence.
We continuously collect and organise proprietary consumer observations across African markets.
We combine that evidence with applied AI, analytical methods and experienced researchers to produce intelligence grounded in actual consumer responses.
AI accelerates what we can do with evidence. Kasi invests in creating and maintaining the evidence itself.
Built over time. Developed across markets. Designed to support analysis.
- African markets since 2016
- 21
- Market coverage across Africa's largest consumer economies.
- Consumer datasets
- 500
- Consumer, financial, retail, brand and thematic intelligence.
- Data points
- 100M
- Accumulated observations and responses across Kasi research programmes.
- Interviews a year
- 120,000
- Continuing primary data collection supporting Kasi intelligence programmes.
- Historical series for selected indicators
- 7+ years
- Supporting longitudinal analysis where definitions and methods are sufficiently comparable.
These figures describe Kasi's broader intelligence assets. Coverage, historical depth and update frequency differ across datasets and countries.
Measure what is changing.
Kasi continuously measures consumers, markets and economic conditions to identify the signals that matter to decision-makers.
-
Kasi Consumer Confidence Index
A monthly read on how African consumers feel about their finances, job security and spending intentions across 8 markets.
+4.8Expansion
Africa-wide composite
-
Retail Demand
Category-level demand momentum for FMCG and retail, drawn from point-of-purchase and consumer panel data.
Improving
-
Financial Wellbeing
Household financial pressure: savings, debt stress and discretionary capacity.
Under pressure
Household level
-
Purchase Intent
Intent-to-purchase signals ahead of spend, segmented by category and income band.
Stable
-
Consumer Basket Index
The cost and composition of a representative household goods basket across markets.
112.4+1.7 pts
-
Other trackers
Further trackers are in development.
Ask about the tracker roadmap
How Signals are built
Signals are built from continuous primary data collection across Kasi's research infrastructure in 21 African markets, combined with external economic data and, where relevant, client data. Each signal is trended monthly to show the direction of travel.
Methodology and market coverage are available on request.
Request Methodology & Technical DocumentationOne consistent consumer signal. Every month. Across African markets.
The Kasi CCI measures how urban African consumers see their finances, current conditions and the future, from Kasi's own monthly survey data, on a scale from −100 to +100.
Kasi's consumer data covers 21 African markets; the CCI is published for 8 of them.
- Coverage
- 8 African markets
- History
- From June 2016
- Frequency
- Monthly, released on the 15th
- Population
- Urban adults 18+
- Sample
- About 500 interviews per market each month
- Scale
- −100 to +100
Historical example. Live monthly readings are in Kasi Terminal. Request Terminal access
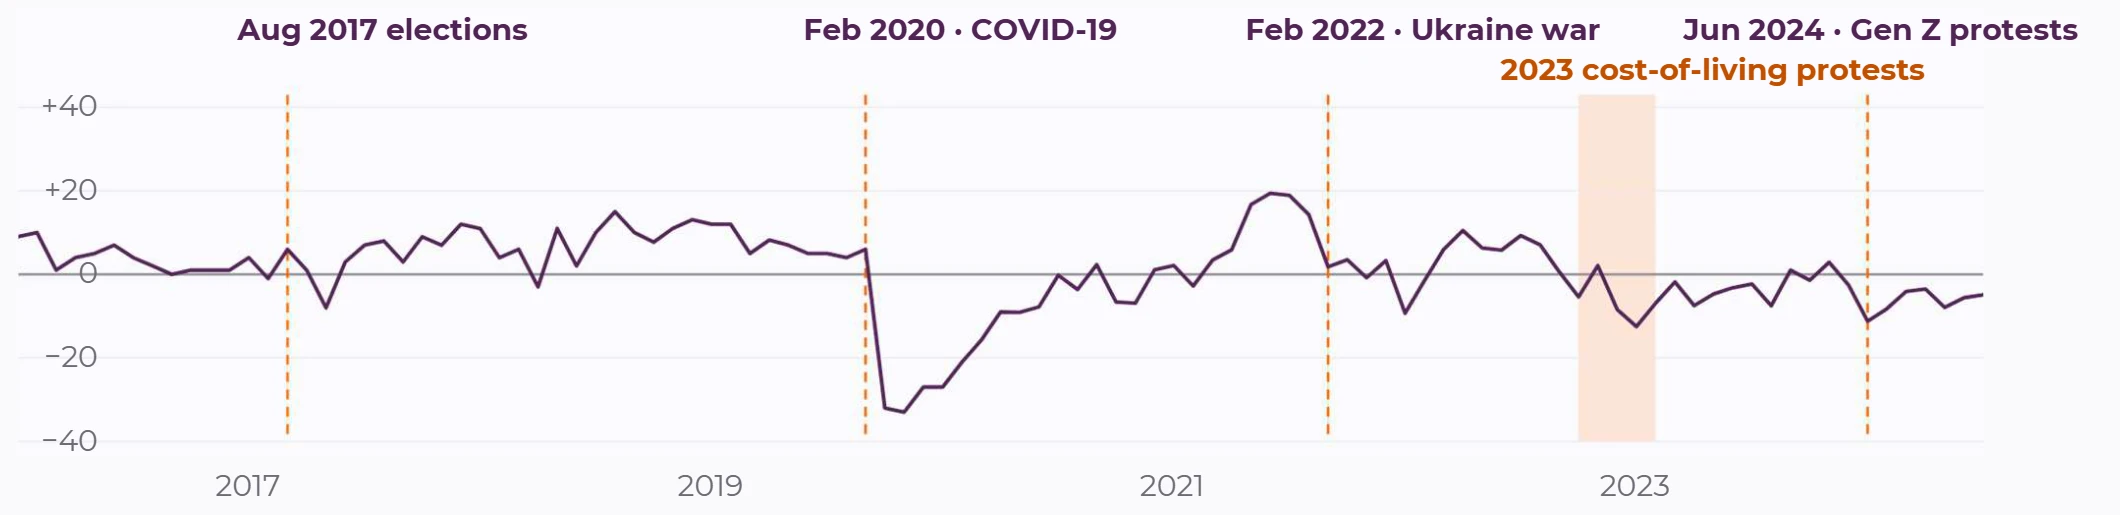
Source: Kasi Insight, Kenya, 50,400 interviews.
Headline CCI by market, August 2024
Historical example. Live monthly readings are in Kasi Terminal. Request Terminal access
- Kenya−4.1
- South Africa+27.5
- Nigeria+10.5
- Ghana+13.5
- Tanzania+42.2
- Cameroon+6.0
- Côte d'Ivoire+22.3
- Ugandan/a
Uganda: no data that month.
How the index is built
The questions and the scoring
Current conditions average of 2 questions
- Discretionary purchases now
- Labour market conditions
Future expectations average of 5 questions
- Economic expectations for the country
- Economic expectations for the local area
- Household income expectations
- Household spending on essentials
- Household spending on discretionary items
Each question is scored as a balance: the percentage of positive answers minus the percentage of negative ones. Neutral answers neither add nor subtract, so 52% positive and 20% negative gives +32.
The headline CCI is the equal-weight average of all seven scores. Below 0, negative answers outweigh positive ones; above 0, positive answers outweigh negative ones. The direction of change matters as much as the level.
It measures what consumers perceive and expect. It is not a measure of GDP, spending, credit performance or returns, and it complements other data rather than replacing it. The headline, both sub-indices and all seven questions are delivered monthly.
Understand consumers beyond traditional demographics.
Consumer Confidence & Expectations
How are consumers feeling about their economic prospects? Are expectations improving or deteriorating? Which groups are experiencing the greatest changes?
Applications: Economic monitoring, strategic planning and consumer sentiment analysis.
Cost of Living & Household Pressure
How are households experiencing affordability challenges? Which financial pressures are most widely reported? How are these changing over time?
Applications: Consumer resilience, affordability analysis and market planning.
Financial Behaviour & Financial Freedom
How do consumers approach saving, borrowing, investing and financial security? Where do needs and behaviours differ across groups?
Applications: Banking strategy, product development and financial-sector research.
Consumer Basket & Retail Demand
What are consumers purchasing? How do category patterns differ? Where are consumer demand signals strengthening or weakening?
Applications: FMCG strategy, category planning and retail intelligence.
Share of Wallet
How are households allocating spending across needs and priorities? What trade-offs emerge under financial pressure?
Applications: Consumption analysis, product strategy and consumer segmentation.
Banking & Brand Intelligence
How do consumers perceive financial institutions and brands? Which factors influence consideration, preference and customer experience?
Applications: Competitive positioning, customer strategy and brand intelligence.
Thematic & Emerging Consumer Issues
How do consumers respond to emerging technologies, sustainability, media, social issues and changing market conditions?
Applications: Innovation, scenario planning and strategic research.
See which markets and channels actually exist.
Kasi maps physical markets through on-the-ground collection, geo-tagged evidence, GIS and data science.
The aim is to reveal which markets and channels actually exist, so decisions rest on ground reality rather than assumptions.
Discuss Ground-Market Intelligence- Retail census and outlet-universe development
- Outlet mapping and cooler and asset verification
- Trade-visibility audits and distribution intelligence
- Out-of-home advertising verification and geo-intelligence
- White-space analysis
Credible intelligence begins with understanding where the evidence comes from.
Kasi uses structured primary consumer data collection across selected African urban markets.
For relevant survey programmes, respondents are recruited through businesses and recruitment locations strategically selected to reach consumers with different socioeconomic backgrounds and lifestyles.
Demographic quotas, including age, gender and income, are used to manage the composition of participating respondents.
Some respondents may participate in more than one survey wave.
Our data lifecycle
-
01
Recruitment
Identify recruitment locations and eligible participants according to the applicable study design.
-
02
Quota management
Monitor participation against specified demographic and market quotas.
-
03
Data quality review
Apply the fieldwork checks, validation procedures and review processes defined for the survey programme.
-
04
Indicator development
Organise observations, calculate relevant indicators and document definitions and coverage.
-
05
Analysis and interpretation
Examine trends, segments and comparisons, while accounting for data limitations.
Sampling, continuity and documentation
The sampling approach
Kasi's relevant consumer survey programmes use structured nonprobability sampling rather than random selection from a complete population sampling frame.
Consequently, conventional probability-sample margins of error and confidence intervals should not automatically be attached to these results.
Quotas help manage sample composition but do not eliminate selection bias or guarantee population representativeness.
Findings are interpreted in light of their recruitment design, sample composition, question wording, geographic coverage and historical comparability.
Historical continuity matters.
A long series is valuable only when analysts understand whether observations remain comparable across time. Material changes in survey questions, respondent composition, geographic coverage or calculation methods can affect interpretation.
Kasi identifies relevant methodological changes in applicable technical documentation and advises users to assess their implications before comparing periods or building models.
Responsible analytical use
Consumer indicators can provide useful signals, but they do not automatically establish causation, predict economic outcomes or guarantee commercial performance.
For forecasting, investment and credit-risk applications, institutions should independently validate relationships against relevant observed outcomes.
Technical documentation covers
- Indicator definitions and calculation methods
- Country and geographic coverage
- Collection periods and update frequencies
- Respondent recruitment and quota design
- Available weighting information
- Data validation and quality-control procedures
- Questionnaire and methodological changes
- Historical comparability and known limitations
- Appropriate interpretation and permitted analytical use
Built for institutional analysis
- Economists
- Banks & Risk Teams
- Asset Managers & Investors
- Corporate Strategy Teams
- Universities & Research Institutions
Kasi consumer intelligence has been distributed through established financial information channels, including Bloomberg and Refinitiv Eikon. Specific data availability, distribution arrangements and usage rights vary by platform and product.
What intelligence is missing from your next decision?
You may need a historical indicator, a tailored analysis, a licensed dataset or a new research programme.
Start with the business question.