Mercy Cyrus
August 1, 2025
Share article

Kasi Insight’s Share of Wallet Tracker provides a broader view into how African consumers allocate their monthly spending across essential needs and categories. In Tanzania, the data captures how households prioritize rent, mortgage, and utilities relative to their overall expenses.
Among households, 29% spend between 21% and 30% of their total monthly expenses on rent or mortgage, the most common spending bracket. Meanwhile, 50% spend 20% or less, suggesting that housing remains relatively affordable for many families. Utilities place even less pressure on household budgets, with 66% of respondents spending 10% or less in this category.
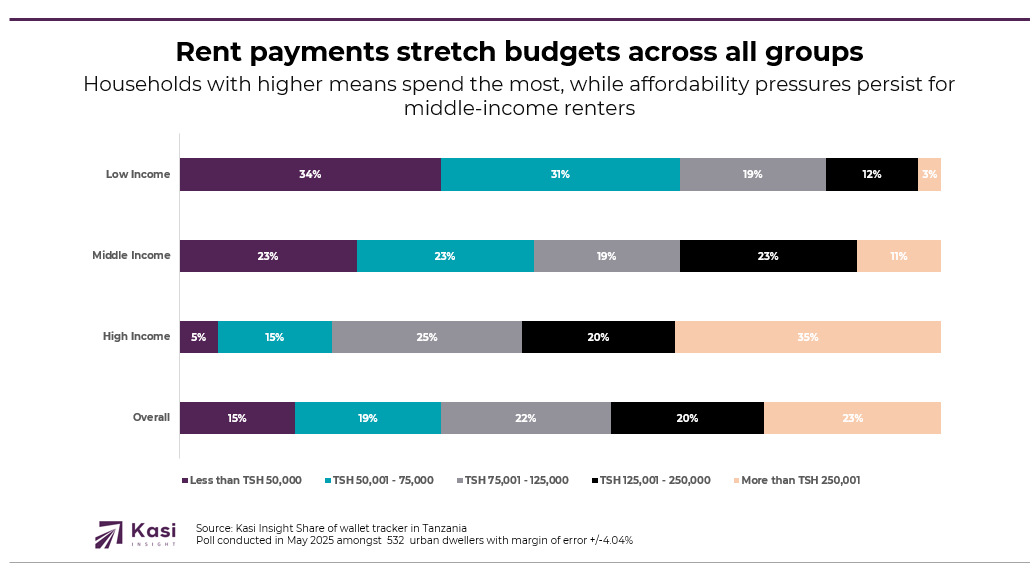
Housing costs vary widely by income group. Among high-income earners, 40% allocate between 21% and 30% of their income toward rent or mortgage. Middle-income households are more mixed, with 24% spending 11% to 20%, and 18% spending between 21% and 30%. In contrast, 62% of low-income households spend under 10%, often due to shared housing or limited options.
Utility spending also reflects income-driven differences. A majority of middle-income households (54%) spend 5% to 10% of their income on utilities. Among high-income earners, 44% spend 11% to 20%. For low-income households, 73% keep utility spending under 10%, suggesting either reduced consumption or limited access to services.
While the majority of Tanzanian households report modest housing expenses, actual rent and mortgage spending highlights significant gaps in access and affordability. About 76% of households spend below TSH 250,000 per month on rent or mortgage. The most common spending brackets are TSH 75,001 to 125,000 at 22%, TSH 50,001 to 75,000 at 19%, and TSH 125,001 to 250,000 at 20%. Only 23% of households spend more than TSH 250,001 monthly, reflecting limited access to higher-end options.
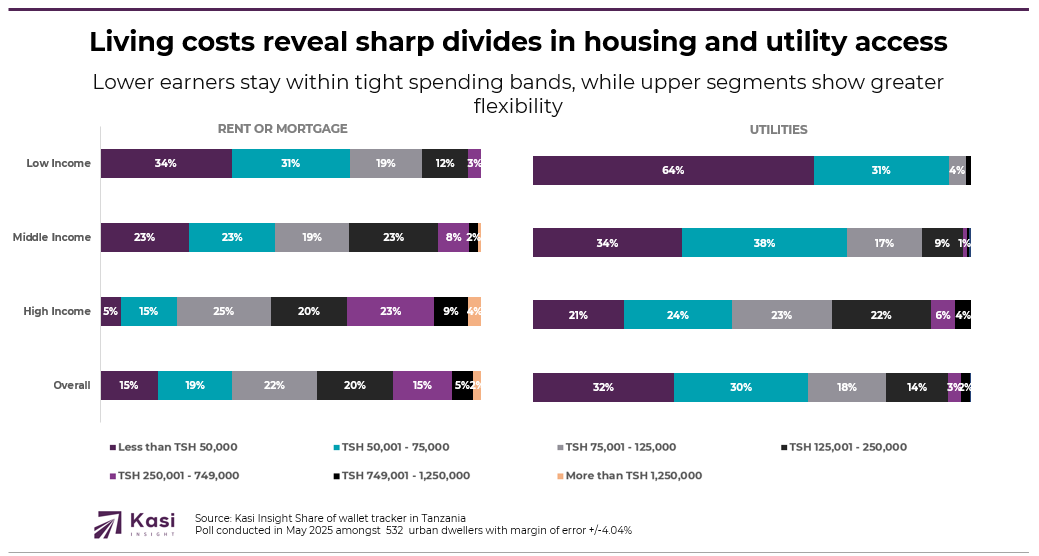
Income levels play a strong role in this distribution. Among high-income earners, 35% spend above TSH 250,001, reflecting greater access to premium housing. Middle-income households are concentrated between TSH 50,001 and TSH 250,000. In contrast, 65% of low-income earners spend below TSH 75,000, highlighting constrained choices and tighter financial margins in this segment.
When selecting housing and utility services, Tanzanian households are guided first by price. Affordability is the top decision-making factor for low- and middle-income groups, while high-income earners place slightly more emphasis on brand reputation.
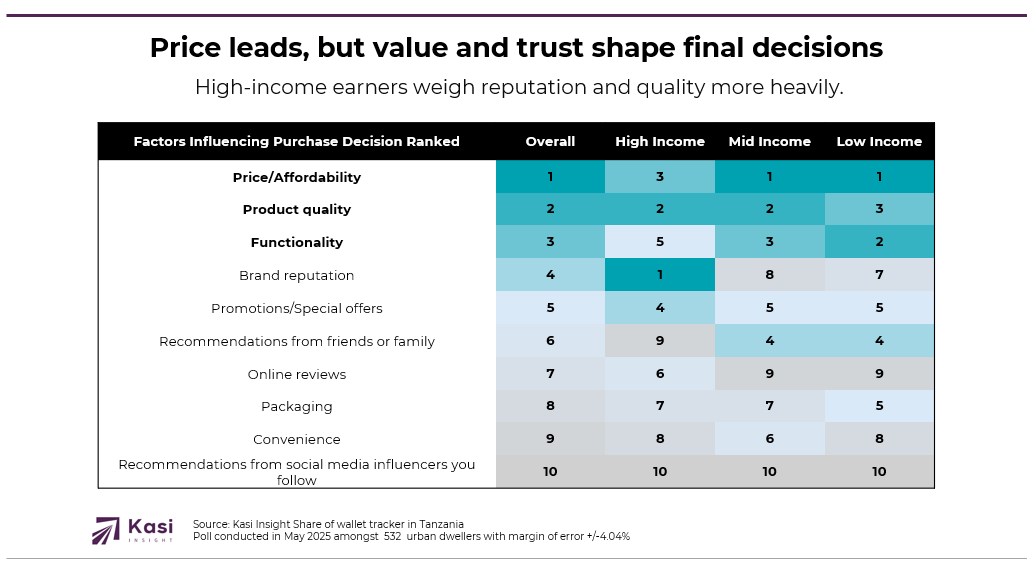
For low- and middle-income households, functionality and product quality follow closely behind affordability. These consumers seek solutions that are reliable and budget-conscious. Personal recommendations also carry weight for middle-income earners, who rank them fourth in influence. High-income households are more likely to rely on brand image and online reviews. Social media ranks lowest across all groups, indicating that housing decisions are driven more by value and practicality than trends.
For real estate developers and utility providers in Tanzania, aligning offerings with how households actually spend is key to building trust and growing market share. Flexible and affordable options such as pre-paid utility plans, low-deposit rentals, and functional housing units are essential for reaching price-sensitive consumers in the middle- and low-income segments.
However, competitive pricing alone is not enough. Providers must also build credibility and communicate clearly. High-income earners may gravitate toward trusted brands, but all consumers prioritize transparency, reliability, and service quality. Companies that emphasize cost-effectiveness, convenience, and functional value in their messaging are more likely to convert interest into adoption.
In a market where consumers are increasingly disciplined and cautious about their finances, brands that reflect everyday spending behavior and offer tangible value will stand out and earn long-term loyalty.
Share on socials using this caption: 🏠 In Tanzania, most households spend modestly on rent and utilities, but access, pressure, and priorities shift across groups 💡 Price still leads, but value, trust, and functionality matter too. #KasiInsight #TanzaniaHousing #ConsumerTrends
1904 views
Share article
Uganda Banking Sector 2025: Growth with Discipline, What Marketing Signals Reveal About Balance Sheets
Kenya Banking Sector 2025: Reading the Balance Sheet Through Marketing Signals
How Consumer Sentiment Predicts South Africa’s Credit Cycles